Geographic information systems (GIS) are becoming increasingly essential for South African farmers seeking to build climate resilience, improve productivity, and make smarter decisions on the land.
According to the GIS and Remote Sensing guide by the Agricultural Business Chamber, GIS, a form of precision farming, is among the most recent advancements in optimising returns from farm resources. By integrating remotely sensed data, farmers can make more informed management choices to increase profitability.
These digital tools allow farmers to gather, manage and analyse spatial data. This data can visualise environmental trends over time, identify risks, and adapt practices accordingly. Whether you’re planting crops or raising livestock, GIS helps ensure that you’re making data-informed choices that can improve your farm’s performance and long-term sustainability.
Dr Tara Southey, post-doctoral researcher at Stellenbosch University and founder of TerraClim, says GIS is reshaping how farmers relate to their land and climate. With climate change making seasons increasingly unpredictable, having access to real-time, location-specific data gives farmers the insight they need to respond swiftly and effectively.
Related stories
- Take farming to the next level with drone technology
- Data-driven citrus farming keeps SA ahead of the curve
- Climate change resilience: Practical strategies for farmers

What is GIS?
Southey says, “GIS stands for geographic information systems. It is a software tool that can answer any question starting with ‘where’.” In agriculture, this includes: Where are the most fertile soils? Where is the drought risk highest? Where do crops perform best?
GIS software allows users to overlay multiple data layers, like terrain, elevation, rainfall, or temperature, to better understand the land. “It all starts with the digital elevation model, which is a model of the earth’s surface,” Southey adds.
Using GIS, farmers can calculate slope percentages, determine sun-facing aspects, and even track underground water or terrain wetness.

Visual farming
Southey notes that GIS tools can visualise farm data in powerful ways. “You can do a heat map to start seeing where you’ve got higher concentration or lower concentration on a farm. It’s a really nice tool to just visually review your farm.”
These visual maps not only assist with immediate decision-making, such as when and where to plant or irrigate, but also help build a historical archive for comparing seasons over time.
Where should a farmer begin?
The good news? GIS is no longer just for tech experts. “There are some free options available. It’s called QGIS. It’s a free GIS platform, and has most of the functionality that the paid GIS software also does,” Southey advises.
She adds that YouTube tutorials and online communities are incredibly helpful for beginners.
“You really want to make a wise and effective decision, and that’s where TerraClim starts using technology and GIS to start looking at where do sites work and why are they working.”
From terrain to profit
Is GIS technology worth the investment? Southey believes it is, emphasising that aligning farming practices with terrain data can lead to improved profitability. For instance, a field with underground water may need to be harvested at different times because different parts of the same field have varying water content, which could affect crop maturity, yield, or harvest timing. This is something only visible through GIS analysis.
GIS also supports variable rate applications, saving money on fertilisers and sprays by applying only where needed. “It’s really using technology to see where the weaker areas and the stronger areas are and then changing your application in alignment with that. That naturally drives better economic outputs,” she adds.
Integrating GIS with drones and remote sensors
GIS doesn’t operate in a vacuum. It integrates seamlessly with other precision farming tools like drones, NDVI (normalised difference vegetation index) sensors, and automated irrigation systems. “When you fly your drone, you’re essentially getting lots of little points which then become a map, and that is what you would then put into GIS,” Southey explains.

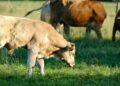
GIS in livestock management
GIS isn’t just for crops. Whether you’re monitoring stock theft with GPS tags or managing rotational grazing systems, GIS provides numerous advantages.
Farmers can use GIS tools to map their farms and divide them into grazing camps, enabling planned rotational grazing. This approach helps track livestock movement, monitor stocking density, and link environmental factors like biomass and rainfall to animal performance for more informed management.
“You can also bring in NDVI images and start looking at biomass indexing, how much grazing do you actually have year on year?”
Water management also benefits. “You can map your water sources and look at your troughs. There’s technology available where you can put sensors in your water metres that also feed through into your GIS interface,” Southey says.
READ NEXT: Empowering farmers to tackle climate threats with agritech
No farm is too small for GIS
Many small-scale farmers worry that GIS might be too complex or expensive for their operations. However, according to Southey, any farm size can use GIS; it all comes down to the resolution of the data you access.
Through a project funded by the department of science, technology and innovation (DSTI), a new platform is being developed. “The aim is for a small starting farmer to drop a pin. And as soon as they drop a pin, that’s when GIS comes alive.”
This platform draws on data from the CSIR, ARC and TerraClim to create a rich environmental profile for any location in South Africa.
“The more you monitor, the more control you have in motivating an insurance company or to a financier, or to an offtaker, why your product is better,” she says. GIS can help prove that a crop failure was due to extreme weather, not poor practice.
GIS and sustainable farming
GIS plays a key role in building sustainable and climate-resilient farms. “Climate resilience is my absolute passion. For me, starting to understand your climate vulnerability starts with looking at what has happened on your farm over the last five years,” Southey says.
Temperature profiles, rainfall patterns, and local climate shifts can all be analysed to guide better planting decisions. For example, understanding heat stress trends might prompt farmers to switch to earlier or later ripening cultivars.
“Everything, when you look at sustainable agriculture, comes back down to soil,” she adds. Healthier soils help crops endure environmental stresses, and GIS data can help farmers identify soil management strategies that work.
Getting started with GIS tools
Adopting geographic information systems (GIS) tools may seem daunting at first, but there are several support avenues available to help farmers build confidence and skills in this area.
Platforms like TerraClim offer guidance through consultations and step-by-step walkthroughs, helping users understand how to apply GIS in everyday decision-making. For those interested in self-directed learning, structured QGIS courses are available through platforms such as Udemy, allowing farmers to work through the content at their own pace.
Southey highlights the role of the Geo Information Society of South Africa (GISA), which supports the local GIS community and offers practical training for beginners.
READ NEXT: Why bull performance testing is key to herd success